
Hotel Applications Received: Hotel Overlay Adoption
Welcome
This dashboard provides information on the impact of the Hotel Overlay District (“Overlay”) that prescribes where new hotels may be permitted by-right and includes requirements designed to offset impacts and meet key community goals. The Hotel Overlay map was implemented by Ord. No. 4856 on 02/23/2021. The initial language for the Hotel Overlay UDO amendment was adopted on 02/23/2021 by Ord. No. 4855 and substantially amended by Ord. No. 4920 on 12/14/2021.
The Hotel Overlay includes an incentive to incorporate high priority public benefits, such as contributions to a reparations fund and affordable housing; public art and neighborhood improvement; support for Minority- and Women-Owned Business Enterprises; and options for living wages and green building elements. These are all options that are selected by the applicant from the Overlay’s Public Benefits Table.
A final element of the Hotel Overlay includes a revised design review process that promotes quality architecture and building design.
This page reports all applications that have submitted applications under the Hotel Overlay. Applications that are unable to meet the requirements of the Hotel Overlay follow the traditional conditional zoning process.
About the overlay
The Overlay requires applicants to file a proposal showing how they intend to achieve compliance with the public benefits requirement at the review stage. Actual final compliance is required at the issuance of final approval for occupation and use. Applicants may modify selected compliance options up to this final stage depending on conditions related to the project. Prior to this, all compliance options are considered as “proposed”.
About this site and dashboard.
The dashboard provides real time data from a variety of city sources that is updated every two weeks by staff in the Planning and Urban Design Department. An application is included in the dashboard immediately after the initial planning review is completed.
This site will load with report pages most relevant to the associated text description. If you have any questions about the dashboard, data, or the Overlay please email: Clay Mitchell Urban Planner II
Level of Project Review
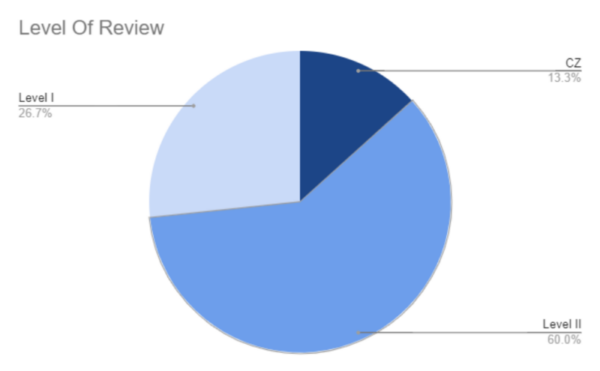 This chart provides the composition of the Level of Review set by the City’s Unified Development Ordinance (UDO) for all hotel development applications submitted to the City since the adoption of the Hotel Overlay and the Public Benefit Table. Only those that fall under the Level I and Level II category of review are eligible to participate in the development incentives that require use of the Public Benefit Table.
As noted above, hotel projects that require a Conditional Zoning (“CZ”) are not required to comply with the Public Benefits Table and are not included in the rest of this dashboard.
Listing of Hotel Overlay Submitted Applications
Only those hotels that seek review as a Level I or Level II development application are eligible to participate in the incentive program that uses the Public Benefit Table. For each submitted hotel development application, the table lists the status of the application and the latest date for the milestones listed in the bar chart. Only those hotels that have reached completion have fully satisfied their public benefits requirement. In accordance with North Carolina law and City of Asheville ordinances, final compliance is due as part of the final zoning approval.
Progress for hotels is noted in phases and can be found under the heading “Current Step”.
-
“Planning Review” indicates a formal application is submitted and under city review.
-
“Final TRC” is final planning stage. This is the last planning step required before seeking building permits.
-
“Permitting” represents that the application is formally seeking permits to begin construction. Intensive review by multiple city departments is required at this stage.
-
“Construction” recognizes that the development has initiated physical changes on the site in furtherance of the project.
-
“Completion” signals that the project has completed construction and satisfied all requirements for occupation and use as a hotel. Final compliance with the benefits table is due prior to “Completion”.
The date column refers to the date the application moved into the current step.
Hotels, Rooms and Required Public Benefit Points
The table below lists the same hotel developments described above. For each submitted hotel development application, the table also lists the corresponding new guestroom count and number of public benefit points required under the City’s hotel overlay requirements. The point totals derive from the Benefits Table and are based on the location and number of new guestrooms proposed.
To view the Hotel Overlay section and/or Public Benefits Table language in the City of Asheville’s development ordinance – click on the buttons below.
Public Benefits Table
Individual Hotel Proposed Public Benefit Monetary Contributions
This table lists all hotel developments that have opted to seek approval under the Hotel Overlay and their proposed monetary contributions. The contributions are listed by category by individual hotel. This table only includes compliance options that require a contribution of funds to support public benefits and the amount of funds required based on the Public Benefits Table. The following acronyms related to the contribution options and are used in the tables:
-
“AH RF” = Affordable Housing/Reparations Fund ,
-
“Nghbd Imp” = Neighborhood Improvement contribution to the city,
-
“Public Art” = Contributions to the city to support public art efforts,
-
“Sppt MWBE” = Supporting Minority and Women Business.
All of these groups require contributions to the city to support efforts in these categories. See below for further descriptions of these individual groups and compliance elements.
Total of Proposed Public Benefit Monetary Contributions
The display cards below lists the total of each incentive by group. This amount is broken out by category in each group. The table includes all proposed and paid funds since the adoption of the Hotel Overlay.
Group 2 Options
The number above shows the total amount of funds committed to the Group 2 options of the public benefit table. At least 50% of all points must come from Group 2 funds. There are 5 options (only the first three result in a contribution):
-
$3,000/room to the city’s Housing Trust Fund (HTF) or Reparations Fund for 100 points.
-
$4,000/room to the city’s Housing Trust Fund (HTF) or Reparations Fund for 120 points.
-
$6,000/room to the city’s Housing Trust Fund (HTF) or Reparations Fund for 210 points.
-
Production of newly constructed affordable for-sale housing at a rate of 0.1/room at 80% AMI permanently affordable (~$240,000 as defined and updated by the city) for 120 points.
-
Production of newly constructed affordable for-sale housing at a rate of 0.2/room at 80% AMI permanently affordable (~$240,000 as defined and updated by the city) for 210 points.
Group 4 Deductions (not shown in table)
Group 4 represents deductions from the point tally.
-
Demolition of historic structure for (-50) points.
-
Displacement of business/housing unit within 24 months of application for (-20) points.
Group 3 Options
This number shows the total amount of funds committed to the Group 3 options. Like Group 2, only a few of the options result in contributions. There are 8 options along with 4 Urban only options (these projects must be located in the CBD, Biltmore Village or RAD districts). Only Supporting MWBE, Neighborhood Improvement, and Public Art result in contributions:
-
Employee Owned Business (Certified EO by certifiedeo.com) for 80 points.
-
ONE OF THE FOLLOWING:
-
Living wages with inclusive hiring for 70 points.
-
B Corp Certification for 120 points.
-
-
Transportation benefit for 10 points (in conjunction with living wages).
-
Supporting MWBE ($600/room to the city) for 40 points.
-
Contracting with MWBE.
-
Neighborhood improvement ($300/room to the city) for 20 points.
-
Public art ($300/room to the city) for 20 points.
-
Urban Only Options:
-
Outdoor public plaza (5% of site min.) for 20 points.
-
Outdoor public plaza (10% of site min.) for 40 points.
-
Structured public parking (Public parking 25% of rooms on- or off-site) for 100 points.
-
Structured public parking (Public parking for 50% of rooms on- or off-site) for 140 points.
-
Monetary Contribution Comparison
This chart shows the comparison of monetary contributions for all hotel applications sorted by total overall contribution. The height of the bars allows for a comparison of contribution by compliance group and across each hotel application.
Completed Hotel Projects
This table shows all hotels that have applied for approval and completed their zoning compliance stage since the adoption of the new hotel overlay district. Most will be ready for final occupancy but some applicants may complete their contribution obligations a bit earlier.
The pie chart shows the total contributions actually collected by the city listed by hotel against the total proposed by all hotels subject to the Overlay. This result is reported as a percentage.